Analytics Services

what we do
Best-in-Class Analytics
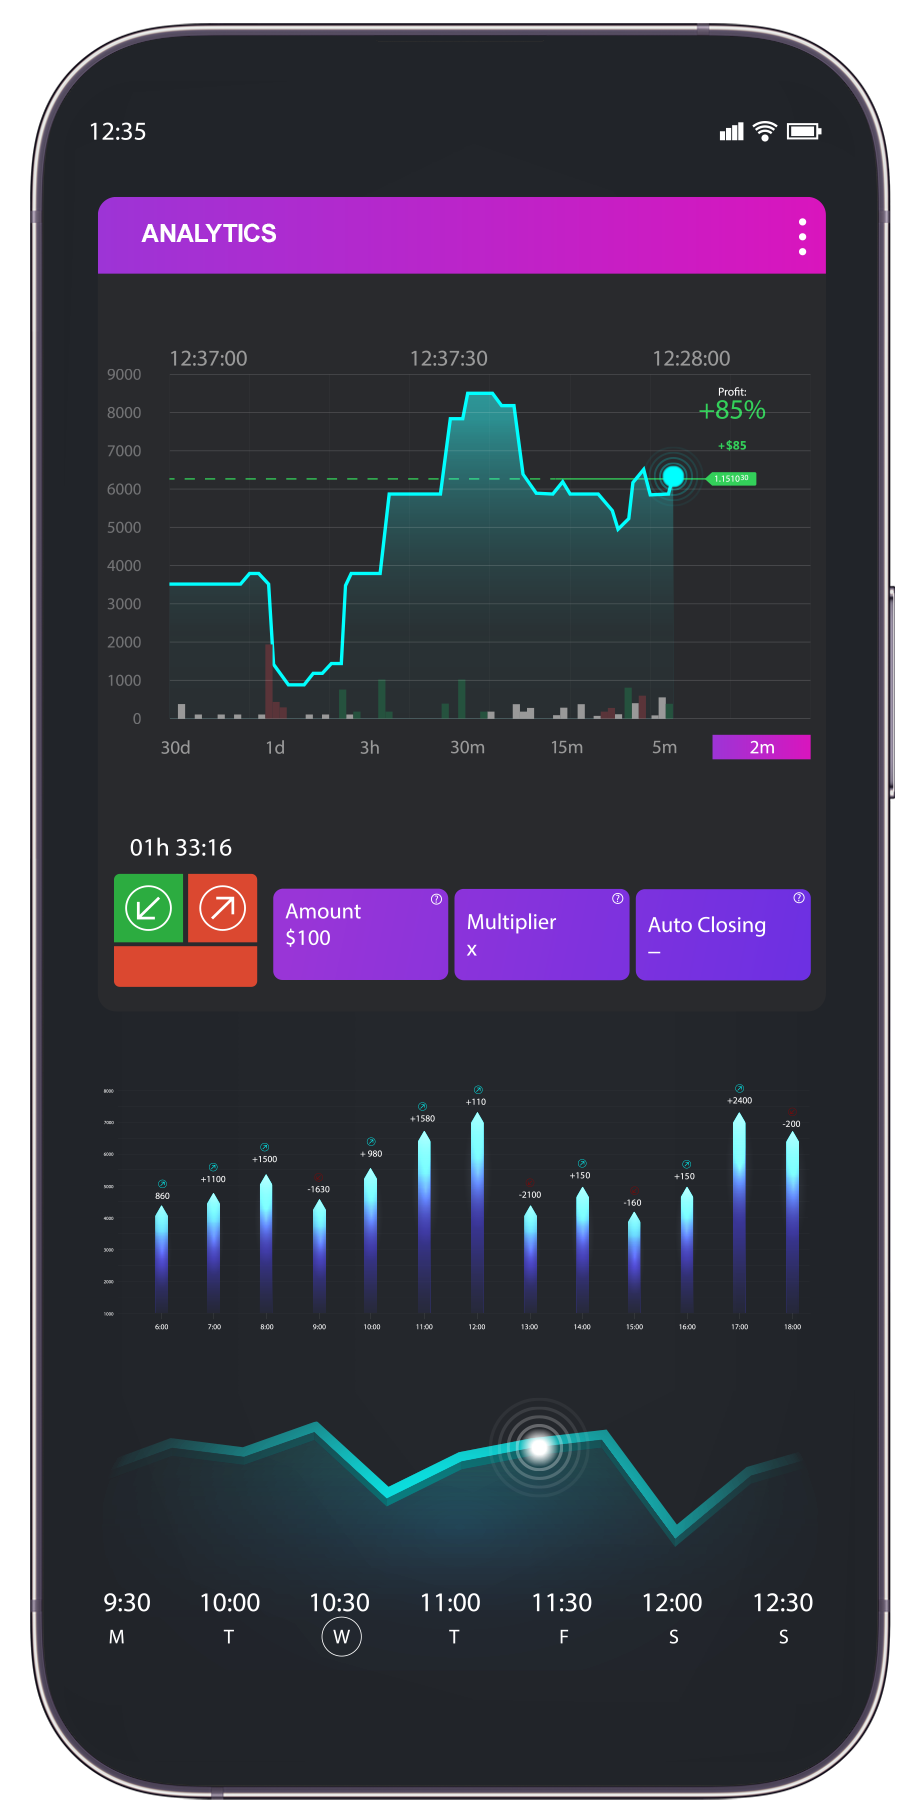
Advanced analytics and measurement capabilities designed to bring you more meaningful insights, faster.
- Robust data at your fingertips leveraging fully automated reporting.
- Blazing-fast data visualization dashboards powered by BigQuery.
- Full-funnel reporting and analytics.
Our services
How We Can Help?

Powerful Visualization
Fully customized, robust Looker Studio dashboards, powered by BigQuery, for lightning fast load times.

Enhanced Automation
ETL tools capable of integrating CRM data automatically, for more accurate, faster reporting.

Monthly Reports
Recurring reporting with actionable insights and clear next steps, built specifically for you.

A/B Testing Insights
Always-on access to test results, including real-time statistical significance indicators.

Ad Hoc Analyses
Faster, more accurate analyses when you need them.

Daily Trackers
Internal, automated daily trackers to keep a close eye on recent performance and trends.
Get Your Questions Answered, Quickly

How is the new landing page performing?
Get real-time access to A/B test results, with statistical significance indicators.

How are we trending year-over-year?
Leverage our custom-built Looker Studio dashboards to view YoY and other trends.

Did it work?
We don't just set it and forget it. We utilize an initiative-based model that focuses on key account changes and the impact they're having on results.


How did we perform over the weekend?
Utilize automated daily trackers to check weekend performance and recent data trends (7, 14, 30 and 60 days).

What are the key factors driving performance?
See detailed analyses that identify key factors impacting results.

Is this site-wide or channel-specific?
It's common to ask whether certain results are channel-specific or part of a broader trend. Our dashboards provide high-level insights and our team will dive more deeply, to evaluate root causes.

