
Consider These Three Things To Succeed with Report Automation
Reporting, some folks refer to it as a necessary evil, and others call it a fundamental tool for business. No matter what your thoughts are on the matter, if you are reading this, it is because your reporting efforts are taking too much time, costing too much money, or are getting too complex. Hence, you have decided to look into efficient alternatives to make your organization’s reporting efforts easier. You may not know where to start or what to do, but you are not alone.
Part of my responsibilities in my current role is to help surpass current operational efficiency while contributing to the organization’s overall commitment to our customer needs and goals. Our reporting mission is not to provide a one-size-fits-all type of report but one that is carefully customized to each of our clients. This means that I am responsible for designing, developing, and testing our report automation efforts for every account that we manage.
Since I have already started with this project, I decided to share a some of my experiences in the hopes that they either guide you or help you save time. The main thing you must know is that you do not need a massive budget to make reporting automation work. You can make your automated reports as elaborate or as simple as you wish, and your outcome can be a very cool dashboard or a very insightful Excel file. Therefore, because the possibilities are endless, I decided to make these tips as general as possible while sometimes leveraging two of my daily go-to data sources to illustrate some of my points. Without further ado, these are the three key things you should consider:
- What are you trying to accomplish?
The design of your automated report is going to be directly proportional to the desired goal you wish to accomplish. There are several approaches to pull data, analyze it, and present it. Thus, an automated report whose goal is to minimize reporting turnaround times could look and interact substantially differently than one that aims to maximize accuracy or that will interact as a dashboard-like output. Therefore, in order to build the solution that fit your needs, you and your team need to ask: “What are we trying to accomplish? How are we measuring success?”
The most common answers to this question fall within the following verticals:
- Turnaround Efficiency
- Accuracy
- Compliance & Monitoring of KPIs
- Data Integration
Moreover, the more granular these answers are, the more effortless it will be to develop an efficient solution. It is important to understand that apart from the goal, a clear understanding of all team members and stakeholders of how the final output should look, feel, display, etc. will also be of tremendous value in the development stage.
- Have you considered how business requirements may impact your report in the future?
Business is ever changing and, consequently, reporting is as well. When making the design, potential short-term and long-term changes must be considered and consulting with someone who has prior experience with the particular stakeholder or industry may be very helpful to get a sense of how regularly and what type of changes are usually experienced. For instance, in the PPC space, stakeholders often shift their strategies, which entails launching, pausing, and replacing campaigns, ad groups, copy, and search terms – this can happen at any given point, and thus, reports need to be modified to display the active data. Proactively understanding changing business environments and integrating these into the foundational design of an automated report provide you with the flexibility and dynamism to adapt to unforeseen changes.
There is always going to be an unavoidable instance when new development efforts will have to take place to cater to the evolving needs in question. In prior opportunities, even with the most thorough design and use-case scenario preparation, I have witnessed how new business needs and business questions mean almost an entirely new deployment of the reporting infrastructure. Therefore, I always recommend thoroughly documenting the design process, specifically, any unique features or needs that have to be implemented, so that when a request for a major redesign comes in, you and your team will be able to leverage what you or someone else has done in the past. This can contribute to significant time savings and a much more tailored solution.
Keep in mind that with the documentation process, you should be able to respond to these questions for any step of your report:
- Are all steps documented in full detail? If we were to revisit this design in six months, would we be able to remember where we left off?
- Is there any particular step that is particular to this report? If so, have we documented how we overcame this challenge?
- Is there another alternative to get the same result? If there is, have we tested it to determine which one may be better?
- What tests can we carry out to ensure the design works?
- After the data analysis, are there any gaps or questions left unanswered? (If your answer is yes, you should revisit the drawing board and do the necessary to close the gaps.)
- Could you explain your design with a story? (This will help you see if your data relationship makes sense.)
- Have you looked into the quality, structure, complexities, and limitations of your data source(s)?
According to Google Trends, over the past five years, the number of searches for “Data Quality”, “Big Data”, and “Data Cleansing” have increased by 50% year over year (YoY). We all have heard about the power and uses that data can have in the workplace, social media, sports, human behavior analysis, etc. Most of us have seen some type of dashboard and even heard of visualization tools such as Tableau or Google Data Studio. However, not everyone knows the work that it takes to gather the data to use these tools properly.
One of the reasons for this is that every company has its own strategy and design for their OLAP cubes, databases, overall data sources, etc. Another reason is that none of the processes that happen behind the scenes are as engaging as a dashboard. Nevertheless, if you are looking to eventually have or maximize the power of these tools, you must not ignore your data sources.
To illustrate my point, let’s talk about two data sources that our reports tend to leverage: Google Analytics and Google AdWords. While in essence, these two are complimentary platforms and were built by the same company, they do not operate equally in a number of different scenarios, and each presents its own unique challenges. Thus, if you were asked to build an automated report that used both of these sources to show a client how his or her PPC and SEO efforts were performing, how would you be able to seamlessly integrate both of them for your stakeholder?
You have to create or leverage a data relationship. There are several ways to make this work, but I recommend using the following questions as a general guideline to help you determine your next steps:
- Are the data sources inclusive? If so, how are they linked together?
- What metrics are you trying to report on? Is there a possibility that both sources contain the same metric with similar or different results? If they are different, which one will you choose?
- Are there any primary/unique ids that you could leverage to get more granular attribution? (I highly discourage anyone from using alphabetic fields as IDs to create data relationships.)
- Are there any fields that only one of the sources has that could impact the quality or accuracy of your results?
- How will you test the accuracy of the information? (This is particularly important since tools, like Google Adwords, change throughout the day and can generally present results that differ by up to 5%, depending on when you pull the data.)
- Is there any manual entry involved with the process? What steps can you take to minimize human error?
Once you are able to determine the answers to these questions, you will be able to design an action plan that minimizes the vulnerabilities of each source. Finally, in some instances, you will find no relationships in the data, and you must find a way to create one. For instance, if you added to your report additional information from an organic rankings tool and/or social media performance, there will most likely not be a link between these sources and Google Adwords or Analytics. If you find yourself in this situation, you will then have to build a layer where you integrate these sources as you see fit, keeping in mind that, although there is no nexus amongst themselves, they all still are results that pertain to the same client or stakeholder.
I hope that you are able to leverage this information into your reporting automation efforts. From personal experience, being prepared to address these questions before diving into a report automation project will help you maximize the efforts invested, create a better final product, and facilitate management discussions so that you can move seamlessly with your process. Remember that you should always have a defined goal, be able to document and explain your design considering an ever-changing business environment, and finally understand the peculiarities of the sources you are leveraging for the report.
Happy Reporting!
Check Out Google’s Newly Launched Beta: Expanded Text Ads
In the latest shake-up in the world of AdWords, Google rolled out a closed beta for expanded text ads starting in Q2 of 2016. This update came soon after Google’s last big SERP change when they removed the right hand rail ads completely. If you haven’t yet received the details surrounding this update, then you’re probably wondering, what are expanded text ads exactly? How will they benefit advertisers and businesses in the long run? What are the best practices for using this beta to your advantage? Read on to learn about the latest details and expected impact surrounding this beta.
What are Expanded Text Ads?
In essence, expanded text ads are exactly what they sound like. With this beta, Google is giving advertisers 80 characters to work with in description lines (versus the current 70), 2 full headlines with 30 characters each (versus the current 25), as well as a display URL field that auto extracts the domain from the final URL and includes up to 2 separate paths (versus manual display URL input and 1 path). Ultimately, this means Google is giving advertisers nearly 50% more characters to work with in the headlines and description lines alone. Additionally, each display URL has 2 fully customizable paths that can be added in at 15 characters each, whereas previously advertisers were given 35 characters total for the entire display URL, including the root domain.
Part of Google’s new expanded text ad design is that there will no longer be two separate description lines. The headlines will extend across the page (regardless of device) and there will be extra room to highlight your products or services. Google updated the design for a more mobile-optimized experience, especially now that right hand rail ads no longer exist.
How will this benefit advertisers and businesses?
We already talked about how crucial it will be moving forward to secure those top of page results in our article about Google removing the right hand rail, and now that real estate will be more valuable than ever as advertisers expand their ads and take up almost 50% more ad space. Google reports that the expanded ads have the potential to generate a CTR up to 20% higher than current standard text ads, depending on the way the account is set up.
Beyond the increased space to highlight products and services, advertisers will now have more control over what messaging appears next to their headlines. In the current AdWords text ads, Google chooses when/where to display a description line next to the headline of your ad. With Expanded Text Ads, you as the advertiser control exactly what line of text will now appear next to your headline.
Additionally, the display URL functionality that Expanded Text Ads brings will prevent ads from being disapproved by manual error of a display URL not matching up with your final URL domain. Advertisers can also use the 2 new path features to better describe the specific landing page experience (and they have more room to make the display URLs keyword-centric for Quality Score purposes).
What are the best practices to use this beta to your advantage?
In line with current text ad best practices, advertisers will definitely want to ensure they’re maximizing their new character limits as much as possible, and not repeating the same messaging more than once (including within ad extensions). Given how much these text ad constraints are changing, this may mean writing entirely new ad copy to fully leverage all the new features Google has to offer. A good place to start given that ads will likely need to be re-written from scratch, is prioritizing your top performing ad groups.
With this latest beta following the decision to remove right hand rail ads completely, Google is pushing for higher quality top of page ads on the SERP, and Quality Score will be more important than ever. With the highest ranking ads at the top of the page taking up even more real estate, maintaining top of page results will be crucial to generating a strong CTR (especially on mobile). Google has not yet released the exact date it is fully rolling out this update, but this closed beta is expected to launch this summer. A few of our clients are enrolled, and we’ll be testing and reporting back on results once the beta launches.

How Removing Silos Between Your Marketing And Technical Teams Can Help You Succeed In The SEM Space.
Search Engines are becoming smarter. Google, for instance, has recently shifted their model from connecting users to high-quality results, to also becoming a knowledge base in and of itself. The emergence of big data, predictive analytics, answer boxes, and knowledge graphs into Google Search has resulted in customizable results that aim to be more relevant to each user. While these improvements create significant value for the user, they represent a significant threat to companies and advertisers seeking to rank in Google results or advertise through AdWords. Corporations and advertisers have no choice but to adapt to these changes, to strengthen and continuously improve their digital assets to preserve their relevancy in the search and pay-per-click space.
Most parties looking to rank in or to conquer the SEO space aim to “beat the system” by – in other words, by increasing their monetary efforts to send out a message with the hopes that it is either relevant to an audience, or to Google. While that may be a fair strategy for some players, the key to success in this space does not originate solely from outreach, but rather from the alignment of your organization’s marketing and technical teams and the maximization of existing digital assets.
For instance, one of the main problems in the SEO space is digital dilution, which occurs when a site releases a high volume of uncategorized, unrelated or non-compliant content. This content can actually impact your organization’s website negatively, especially when the underlying code for the content is non-compliant with current content best practices or trends.
If releasing content keeps your company’s site relevant, how can new content actually hurt it? Well, this is not always the case, but the problem for most parties is that they consider their technical and marketing teams completely separate entities. Thus, the goals for each are independent and sometimes conflicting. For instance, let’s say that your organization is planning to launch a new website, so the organization gathers the marketing and development team. Since the goal is to create a new, high-impact website, do you think that their priorities will be the same?
Typically, the answer is no. Even as a developer and a search engine marketer myself, I often struggle to align my technical and marketing priorities in a scenario like this. The problem relies on proper communication and joint goals. However, the lack of communication does not fall on either team’s plate, but rather, a much broader underlying management practice towards IT workers that should not be surprising – some managers simply do not know how to manage a technical team. In late 2015 TinyPulse, an employment engagement platform published surprising results. Only 19% of all technical workers in the United States are satisfied with their jobs (versus a 22% national average).
The surveyor concluded that amongst the top reasons for their dissatisfaction, the one that stood out most is the lack of alignment within the company – meaning that these folks are unable to find where their roles fit in with the organization’s values, goals, etc. The second most common reason is a poor connection with their teammates – about 47% of surveyed IT employees claimed to have strong relationships with their coworkers, but in other industries, this number jumped to 56%. Thus, your organization may comprise of a very talented technical team of both marketers and technical employees who are not reaching their full potential because of a lack of inclusion, aligned goals, and stronger bonds. It is up to your organization to build the bridges for mutual collaboration, because without it, each team will continue to work under their silo rather than a mutually defined goal.
Without alignment and inclusion, your organization will not be able to attain “win – win” outcomes that benefit not only the collaboration of these teams, but of the entire organization. An effective digital marketing campaign is relying equally on the messaging and on how the message is served, and the results are measured in increased leads and sales. It is just that simple. In the Search Engine Marketing space it is not your strategies that will not allow you to conquer this space, but rather the prevalence of communication and collaboration between your teams.
I am a huge believer in professional ambidexterity. Every opportunity that I have had to expand my technical or my marketing knowledge has only made me a better professional and equips me with better contributions and insights for our clients. At Synapse SEM, we practice the same philosophy as a key component of our culture, and we continue to be successful where others fail because we understand the technical and marketing needs of the industry. As Google continues to update its ranking metrics, can assure you that by building a united digital marketing front, your organization will be able to succeed no matter how complicated or competitive the space becomes.
Attribution Intro With Visual IQ CMO Bill Muller
Cross-channel attribution is a hot topic these days. We’ve been asked by many clients recently what they need to know about attribution and how it could be used to help improve their marketing results. To get answers, we went to industry leader (and current client) Visual IQ and sat down with their CMO, Bill Muller. Bill’s responses to the key questions related to attribution can be found below. This is a must-read for anyone new to attribution or for anyone considering investing in a cross-channel attribution platform.
Q: Can you explain for folks new to attribution, how does cross-channel attribution work? What are the main benefits of using a cross-channel attribution platform?
A: Cross-channel attribution, much like any discipline, can vary widely depending on the degree of sophistication and complexity of the platform that you use. It’s like asking, “How much does a car cost?” Well, it depends on whether it’s a Prius or a Ferrari.
The way we perform cross-channel attribution is a methodology called “algorithmic” or model-based attribution, which differs dramatically from rules-based methodologies that tend to be flawed and subjective. Algorithmic attribution works as a platform that ingests marketing performance data from both digital and non-digital sources. In the case of digital or “tagable” sources, we often use the ad server tracking that’s already being used by a client. We also use our own pixel to stitch together the various touchpoints that are involved in a user’s journey to a conversion.
That data is then fed into an attribution engine, which is a series of algorithms and machine-learning technologies that chew through the data and fractionally attribute credit for a conversion across the various touchpoints experienced by a user. Rather than simply looking at the order in which those touchpoints took place, the engine measures all of the individual components that make up those touchpoints; for example, channel, ad size, creative, keyword, or placement.
By doing this across an entire universe of users who are exposed to your marketing efforts, the software can calculate success metrics across all channels to show exactly how much credit each touchpoint and each channel deserves. Almost always, when that calculation gets performed, you get a very different picture of which channels, campaigns, and granular-level tactics are contributing to your overall success.
The main benefits are better decision-making and better allocation of budget. Ultimately what people do with the output of the attribution is reallocate budget to any channels, campaigns, and tactics that they previously undervalued. They then fund those by taking budget away from the channels that they’ve historically overvalued, the losers, and provide it to the winners.
Q: Does the platform tend to work better for certain industries?
A: To determine fit, we tend to look at “business models” more than “industries.” Until recently, attribution had been a direct response-related endeavor, meaning that companies using digital and/or digital combined with offline to produce hard and fast conversions, such as an e-commerce transaction, a lead, or a quote, will best benefit from the software. There are many industries that align with this type of business model.
In terms of attribution, business models that historically have been left out in the cold have been companies that do not have those types of transactions in place. In terms of their objective, attribution has primarily been about generating brand engagement, because they do not have a direct line to their conversion event.
Think about, for example, pharmaceutical companies. You are not buying a drug on their website or buying drugs as a result of seeing their TV advertisement, but there are marketing activities that are causing you to experience some brand engagement. Ultimately, you may be prescribed the drug and purchase it, but there is no linkage between their marketing and your purchase. There are no conclusions to draw.
This business model, as a result, has been difficult for attribution to conquer in the past because there hasn’t been a tie between media stimulation and the eventual consumption of an end product. Until recently.
Q: What kinds of recommendations will an attribution platform make? Are they typically budget related or otherwise? Are they typically real-time, on-going, or one-time recommendations?
A: The recommendations are typically budget-related, as we are talking about spending money on individual tactics: moving budget off of less successful ones, onto more successful ones. They are typically not real-time, but daily, because we can only make recommendations at the pace of which our attribution engine is fed with performance data.
The recommendations do, however, absolutely need to be ongoing. Much like a search campaign, it’s not ‘set it and forget it.’ The environment in which you operate is not a static one. It is constantly based on the marketplace, on what competitors are doing, on econometric factors, on global events, etc. It constantly needs to be adjusted based on the dynamic nature of the marketplace. This is ongoing and not a one-time recommendation.
Q: How drastic will the recommended changes be?
A: The type of recommendations can be as granular as the characteristics of the data that is provided. When a lot of people think of attribution, they think totally about the chronology of the touchpoints that have taken place in relation to the number of conversions. They think, ‘This happened first, this happened second, this happened third, and I really can’t control those things.’
What they often don’t realize is that these touchpoints are made up of various characteristics. If it was a display ad, there is size, placement, offer, and publisher to consider. If it’s the search channel, one can consider if it was paid or organic, keywords, impressions, or clicks. So the recommendations that come out of our application are often things like, “Stop spending $500 a month on this ad, of this size, with this creative, on this publisher, on these days, per week. Now take that money and put into this keyword, on this search engine, with this creative, and this offer, on these days of the week.” We include every characteristic of every touchpoint in the model to find out which has the most impact on a client’s overall success.
The recommendations can also be as dramatic as, “Stop spending on certain placements altogether,” or the opposite. We had a client recently that was going to eliminate spending on one display publisher altogether. When they looked at their attribution results, they recognized that instead of it being their worst publisher, it was the publisher that most contributed to their success. They then tripled the amount of spend on the publisher that they were originally going to eliminate from their marketing mix.
Q: Are there channels (Paid Search, SEO, Offline, etc.) that repeatedly prove to drive more or less value than previously believed?
A: Yes – Many clients are highly invested in paid search, but we’ve found that paid search is one of the channels that tends to be universally overvalued in a last-click methodology.
In other words, most of the world is using a last-click methodology to assign conversion credit. If an individual has touched four different times prior to a conversion, odds are you don’t have a methodology in place that can link those four touchpoints together. You don’t always know that the user had touched four times—All you know is that a person converted as a result of a search and a click on a paid search term.
Attribution allows you to tie together the otherwise unknown factors. If somebody was exposed to impressions of a display ad five times prior to their click on a paid search ad, and it ultimately led to a conversion, we can see that.
Q: How does the attribution model handle view-through conversions?
A: Our methodology not only ingests touchpoints that resulted in clicks, but it ingests touchpoints where there was only an impression. For example, you do not have to click to be cookied. When a touchpoint is analyzed, we look at all the constituent parts of it—its size, its publisher, its placement.
Using that data, our solution then calculates how much value a “mere” impression had in the grand scheme of things: What was the difference in performance between those people that were not exposed to the ad and eventually converted, compared to those that were exposed to the ad?
Q: Where do you see attribution technology evolving over the next five years? What will we be able to measure and/or optimize better by 2020?
A: As I mentioned previously, until now, attribution has very much been a direct-response technology. Recently, however, Visual IQ released a methodology that allows us to extend our solutions much beyond direct-response business models. Instead of ingesting direct-response conversions, it uses brand engagement touches— first visits to a website, video views, media asset downloads for example — to come up with a common brand engagement score. The attribution product then optimizes or makes recommendations on how to maximize that assigned brand engagement score.
Not only does this allow us to focus on companies that are pure brand engagement, but it also allows us to help the side of the house that has not been able to benefit from attribution in the past. And frankly, at some companies brand spending far outweighs direct response spending.
Q: What makes Visual IQ different from the other cross-channel attribution vendors in the space?
A: Part of it is our legacy, in that we were one of the first attribution vendors in the space, and that we were the first attribution vendor to offer algorithmic attribution.
From the very beginning, we tackled granularity. We let the machine-learning and the mathematical science do the calculations so that the data we receive tells the story. Because we’ve done this since the beginning, we’ve been able to improve the level of sophistication of our product.
Visual IQ’s products are smarter products. We’ve continued to innovate things like attribution branding and offline media attribution. We have a television attribution product. We are consistently offering features, benefits, and values to our clients before our competitors.
We’ve also been working with enterprise-sized clients since the inception of our organization. The largest, most successful brands in marketplace and some of the most demanding marketers in the world are using our products. We’ve developed our products over the past decade based on their needs and demands.
If we can bring in 17 different channels from one of the world’s largest credit card companies, across multiple countries and business units, and provide them with actionable business recommendations that they can act on to generate millions of dollars-worth of media efficiency, then we certainly have the ability to handle 99 percent of the potential businesses out there. Without our legacy and history of innovating, longevity, and continuing to improve our product, we wouldn’t have that capability today.
Q: For those who are interested in learning more about your platform, what’s the best way for them to get in touch with you?
A: If you have any questions surrounding cross-channel attribution, or to want to learn if Visual IQ attribution software is right for your business, please email me at Bill.muller@visualiq.com.
For folks who are trying to better understand us in the attribution space, we have been at the top of the last three Wave Reports done on our marketplace. By talking to Visual IQ, you can rest assured that you are truly talking to the industry leader.

4 Ways the Removal of Right-Hand Rail Ads Impacts PPC
In late February of this year, Google confirmed that they will no longer be serving PPC ads in the right hand rail of the search results. While this came as a shock to many, it is something Google has been testing since 2010 and just recently decided to roll out permanently. The online giant has a long standing history of discreetly testing out new updates to search engine results, and this one was no different as an anonymous Google employee leaked the permanent change to the media on February 19.
So what exactly does this change mean for paid search advertisers? What shift in results can digital marketers and advertisers expect to see over the next several months as this change in the search engine landscape rolls out? Below are 4 potential shifts to look out for with this recent update in the Google search results.
1) CPCs Might Increase
Over the next several months as more marketers and clients alike begin to notice the change in Google search results, the competition for the top 3-4 PPC search results is going to gain momentum. It is common knowledge in search that users tend to not spend a lot of time scrolling down to look at results below the fold, so marketers are going to be increasing bids to battle it out for the top paid search slots. There are a couple different scenarios to consider here. CPCs have the potential to increase as marketers compete to own those top spots. Alternatively, it is possible that Google may change the minimum Ad Rank requirements so that ads are showing more often and rotate in more evenly. Some of our clients have seen around a 5% increase in CPCs since the new update rolled out over the last couple months. We will be interested to observe how CPC shifts over the next few months after advertisers have had more time to settle in with this particular update.
2) Impression Share Could Be Harder to Maintain and QS May Carry More Weight
As more advertisers notice the change in SERP results, they will begin competing for the top 4 paid search spots which may make it more difficult for advertisers to maintain stronger impression share on their core terms. How will Google determine which ads to rotate in to those top 4 spots? How will that impact impression share? Will it be tougher to maintain strong impression share for your top terms or will Google loosen up the criteria for Ad Rank and rotate competitors in more evenly? One certainty here is that it will be critical to re-evaluate Quality Score on your most important terms to set yourself up for success with all the unknowns of Google’s next steps.
3) More Advertisers Will Likely Be Shifting into PPC
With this new change rolling out, the amount of paid ad space available on the SERP has decreased from up to 11 down to 7. There is, however, one additional spot available at the top of the page for a total of 4 paid search slots, as opposed to 3 in the past. What does this mean for SEO results? They will be pushed further down the page, bringing a higher number of SEO results below fold. Because of this shift in SEO positioning (and drop in traffic) more advertisers will likely be looking into setting up their own paid search campaigns to compete for the top page spots. This may end up adding another layer of competition to the paid search space, which could also have an impact both on CPC and impression share.
4) ecommerce Advertisers Will Likely Invest More Heavily in PLAs, and non-ecommerce Advertisers Will Be Awaiting Their Solution
While right hand rail paid search ads are disappearing completely, Google has confirmed that this change will not impact the Knowledge Panel or the Product Listing Ads on the side rail of the SERP. The strong positioning of PLA ads is optimal for ecommerce companies and retailers who are likely already heavily investing in PLA advertising. This is great news for ecommerce businesses, but there is no alternative solution for either B2B or B2C companies that do not have specific products for sale on their site.
There is currently a lot of speculation circling around the paid search world about how this major shift in search engine results is going to impact marketers and advertisers. Ultimately, the impact will depend upon how advertisers react to this change in landscape. Will they get more aggressive with bids right away, driving up CPCs? Will they take a step back to revise their keyword set and max out impression share on their most efficient terms? Whichever direction the reaction trends, marketers should take a step back to re-evaluate strategy and results to make sure no major dips in performance have occurred.
Some different types of analysis that may be helpful include segmenting traffic and leads by ‘top of page’ results versus ‘other’ both before and after the update to see if there is cause for worry. Advertisers will also want to look into improving Quality Score since it may end up carrying even more weight. To improve QS, advertisers can try segmenting keywords out into more granular ad groups and looking into ad copy and landing page content that is more relevant to the keywords within those given ad groups. To improve expected CTR, try testing queries on high volume terms to see how competitors are positioning themselves and adjust your copy to be more in line with the competition. Is there room to broaden your customer base? Are there unnecessary qualifiers currently in place within your ad copy? Improving overall QS should help minimize the impact of potential CPC increases, and hopefully lead to better overall positioning with negligible impact on CPCs.
Synapse SEM Forms Strategic Partnership with CohnReznick
GLASTONBURY, CT – March 18, 2016 – Synapse SEM™, a full-service search engine marketing firm with offices in Connecticut and Massachusetts, today announced it has formed an alliance with CohnReznick LLP, one of the leading accounting, tax, and advisory firms in the United States.
Synapse SEM will provide a full-scope of search engine marketing services to the renowned financial advisory firm, and collaborate with CohnReznick to expand its Technology and Digital Advisory Practice.
“This is undoubtedly a valuable partnership for us,” comments Synapse SEM Co-Founder Mark Casali. “We are linking with distinguished consulting leaders at CohnReznick to help digitally transform the way their clients do business.”
“Aligning with Synapse SEM enables CohnReznick to extend its technology offerings, particularly enhancing our ability to help clients connect with customers to build profitable and loyal relationships,” said Dean Nelson, Principal and National Director of the Technology and Digital Advisory Practice at CohnReznick. “Synapse SEM meets the demands of our clients by providing deeper insights, maximizing return on investment, and driving profitable growth by minimizing promotional waste.”
Through strategic paid search advertising, search engine optimization, social media marketing, and mobile advertising campaigns, Synapse SEM will help CohnReznick unlock new digital marketing opportunities and optimize competitive strategies across their client base.
About Synapse SEM, LLC
Synapse SEM is a full service online marketing firm that leverages robust data analysis and statistics to provide its clients with deeper insights and uncover otherwise overlooked opportunities. With core competencies in paid search advertising, search engine optimization, social media marketing, mobile advertising and conversion optimization, the company develops, implements, and executes online marketing strategies focused on maximizing its clients’ ROI. Leveraging proprietary data analysis techniques and experienced subject matter experts, the agency is committed to achieving unparalleled results and providing the highest quality of service to its clients. For more information on Synapse SEM, LLC, call 781-591-0752 or visit www.synapsesem.com.
About CohnReznick LLP
CohnReznick LLP is one of the top accounting, tax, and advisory firms in the United States. CohnReznick combines the resources and technical expertise of a national firm with the hands-on, entrepreneurial approach that today’s dynamic business environment demands. CohnReznick serves a number of industries and offers specialized services for Fortune 1000 companies, owner-managed firms, international enterprises, government agencies, not-for-profit organizations, and other key market sectors. Headquartered in New York, NY, CohnReznick serves its clients with more than 300 partners, and 2,700 employees in 30 cities. The firm is a member of Nexia International, a global network of independent accountancy, tax, and business advisors.

2016’s Top Search Engine Marketing Trends
2016 will be a revolutionary year for the digital marketing industry. After a historic 2015, a year in which we saw mobile searches overtake desktop searches, industry analysts are projecting that digital media spend will overtake traditional channels like TV for the first time. Apart from these macro changes, there are more technical developments that will be also be affecting digital marketers in the new-year. We share details on 5 critical trends that should be on your radar for 2016:
- Google Penguin Update – Google Penguin is not a new name to search engine optimization professionals. For those less familiar, Google Penguin is a layer to Google’s organic algorithmic that specifically evaluates link quality. Penguin is designed to discount or even penalize disreputable and manually engineered external followed links. Penguin was originally released in April 2012 and since then it has been refreshed around a half dozen times. This forthcoming release of Penguin, slated to launch in early 2016, marks a major change for the algorithmic layer. Instead of releasing periodic updates, the new release of Penguin will be run in real-time. This is both good and bad for advertisers. For websites suffering from historically spam-rich linking profiles, the benefits of any link cleansing work and disavowals will be felt quicker. In contrast, for websites who aggressively push the envelope on their link-building strategies, penalties and ranking drops will also be assessed and felt faster. The updates coming to Penguin underscore the importance of what has already been a link acquisition best practice for several years. Instead of building links, marketers should instead be focused on cultivating links—organically generating link backs by promoting unique, engaging content.
- Real-Time Personalization – Real time personalization is a growing technology that allows content management systems and advertising platforms to dynamically serve customized content for different cohorts of users. The technology, which is offered through marketing automation solutions like Marketo and CMS platforms like Sitefinity, works by integrating with an organization’s CRM system. A website visitor will get cookied and then the marketer can define different personas or user groups. One persona, say a C-Level executive, can then be served a different website experience (different messaging, calls-to-action, etc.) than, say, a specialist-level user. The same type of personalization can be embedded into paid pay-per-click ad copy and landing pages. This is invaluable technology than can lead to significant improvements in conversion rate and online revenue. If you’re a retailer, you can customize Branded paid search ads to be focused on the previous purchases on repeat customers. If you’re a B2B organization, you can tailor your website experience to the role of your visitor. A researcher may be prompted to download white papers and industry reports, while a decision- maker like an executive could be served deep-funnel calls to action like a demo request.
- RLSA – In mid-2015 Google AdWords expanded their RLSA or “Remarketing Lists for Search Ads” technology so that campaigns can leverage Google Analytics remarketing lists. RLSA allows marketers to integrate retargeting lists with their Search Network pay-per-click ads. Marketers can specifically target (or exclude) past website visitors, based on the pages they visited, or their on-site behavior. Past website visitors are typically more qualified users, so marketers can take a broader approach with their keyword set, and a more aggressive approach with their bidding strategy. As an example, if you’re an online retailer that sells luxury watches, a keyword like “gifts for my husband” would likely yield highly irrelevant/unconvertible traffic. However, with an RLSA campaign, we can aggressively bid on a keyword like “gifts for my husband” because we know the user has already expressed interest in our website/product. Similarly, RLSA can be used to improve traffic quality on traditional Search Network campaigns. For example, B2B SaaS websites often field significant traffic from existing customers who log in to the product through the website. As a marketer you might be running a Branded search campaign aimed at demand generation. Unfortunately, major amounts of your ad spend are likely being wasted on these existing customers who are simply trying to login to their account. With RLSA, we can create a remarketing list of all users who have reached a website’s login page. We can then exclude that list from seeing our Branded ads in our AdWords campaign.
- Mobile Conversion Optimization – Mobile users overtook desktop users for the first time in 2015. With mobile traffic becoming a bigger and bigger percentage of total traffic each year, it’s critical that marketers implement a mobile-specific conversion strategy on their website. In addition to ensuring that your website is fully responsive, marketers can use device detection scripts to serve customized content. For example, a marketer could setup a page to display consolidated messaging, shorter forms (less fields), or different navigation links when a user browses from a device with a smaller screen size like a smart phone or tablet. These types of adjustments can be implemented at the page level and they can have a profound impact on your mobile conversion rates.
- Dark Traffic – As mobile traffic continues to grow, so too does untrackable (not set) or “dark” traffic in our analytics platforms. Dark traffic typically originates from mobile social media and messaging apps. Many of these mobile apps trigger new windows when referral links are clicked. From Google Analytics’ perspective, the user is direct navigating to your website; in reality, the user is arriving vis-à-vis a referral source. For some B2C retail websites, dark traffic is becoming incredibly problematic, and in some extreme cases, it’s comprising over 50% of total website traffic. Many firms are trying to get around this issue by running landing page reports and making educated guesses on the original traffic source of the user. That approach is imprecise at best. Our firm has developed a sleeker solution. The apps engendering dark traffic kill the original traffic source of the user by opening up new browser windows. The majority of these apps also prevent marketers from manually tagging website links with UTM parameters. There is, however, a workaround that can be employed with an interstitial redirect. For example, let’s say a company includes a link to their website in their Instagram profile. The marketer can link to a unique URL that has a delayed interstitial redirect on it that points to a URL (e.g. the homepage) tagged with UTM parameters that communicate the user’s original traffic source. In this example the redirected URL could point to www.acme.com/?utm_medium=referral&utm_source=Instagram&utm_campaign=InstagramProfileLinkClick. This will tell Google analytics that the user came from the Referral medium, from the Instagram app/site, and from an Instagram profile link click.
How Google Determines Actual CPCs Will Surprise You
OK, so you’ve been investing in PPC advertising for years. You know how your KPIs are performing, and how much you’re spending each month. Your in-house team or agency reports back to you on overall performance and dazzles you with insightful and actionable analyses each week. You feel very comfortable with their PPC knowledge and then one day you ask one of the most basic PPC questions: how are CPCs in AdWords calculated? Their response is questionable at best, and you start to think their so-called “expertise” is a sham. They should be able to easily answer this question, right?
Well, before you judge your team too harshly, let us walk you through how CPCs are actually determined and why it’s not a question so easily answered.
How Are CPCs Actually Calculated?
Before we get into the specific calculations, we need to first talk about the AdWords auction and what influences your CPC, position and impression share, since these three metrics are all related. All three metrics are determined by your Ad Rank, a metric that includes your Quality Score, maximum CPC and expected impact of ad formats. The advertiser that shows in position 1 (“Advertiser 1”) is the advertiser whose combination of Quality Score, expected impact of ad formats and maximum CPC is highest. Google first determines the position for each advertiser, and then calculates the actual CPC for each advertiser based on that position.
To really see how this plays out, let’s look at an example:
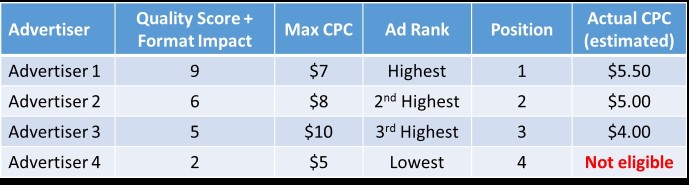
In the chart above, Advertiser 1 will show in position 1 because they have the highest Ad Rank. Once position is determined, the AdWords system then determines the actual CPC that advertiser will pay. Keep in mind that the idea that each advertiser only pays $0.01 more than the next advertiser no longer applies (unless all advertisers have the exact same Quality Score and Format Impact). In fact, it is entirely possible for an advertiser in position 2 to pay a higher CPC than the advertiser in position 1. Advertiser 1’s actual CPC is the lowest amount they can pay while still achieving an Ad Rank higher than Advertiser 2. The CPCs for the other advertisers are calculated using the same logic. Since Advertiser 4 has by far the lowest Quality Score and max CPC, they are likely to be ineligible to show or have extremely limited impression share.
How Can I Use CPC Calculations to My Benefit?
Now that we know how CPCs are determined, how can this help you improve your performance? First of all, keep in mind that ad extensions do play a role in determining your Quality Score, and Google is introducing new ad extensions all the time (they just recently announced structured snippets, for example). You should be using as many ad extensions as reasonably possible, and optimizing your ad extensions at least as often as you’re updating your main ad copy. This will help improve Quality Score, which can help reduce your CPCs and/or improve your position.
Also, this may be obvious, but you should be making regular ad copy testing a top priority. With expected click-through rate and ad relevance accounting for a majority of your Quality Score, it’s critical that you’re using relevant headlines and descriptions that are truly differentiated from your competition and highly enticing to your audience.
Lastly, keep in mind that it’s extremely difficult to run PPC ads profitably with low Quality Scores. Constantly inflating your max CPCs to drive impression share and high positions is not a sustainable strategy. Other advertisers are typically setting their bids to meet profitability, and if they’re showing more often and more prominently, it likely means they have higher Quality Scores. If you end up paying significantly more per click, you should have a strong business case for doing so (e.g. significantly higher conversion rates, better lead close rates, higher customer lifetime value, etc.). You should also continually focus on ad improvements and ensure a relevant landing page experience. The steady, consistent path of testing and analysis (in replace of or in addition to aggressive bid increases) will help you to maintain efficiency as you expand and as competition increases.
If you’re interested in learning more about how CPCs are calculated, see a great video by Google’s chief economist, Hal Varian, or check out these two articles that cover CPCs for the Search network and CPCs for the Display network.
If you’d like to learn more about Synapse SEM, please complete our contact form or call us at 781-591-0752.
Advanced PPC Series: Your Test Results Can’t Be Trusted
Your Ad Copy Test Results Can’t Be Trusted: A Need-to-Read Article for Search Engine Marketers
If you are like us, you’re constantly running A/B ad copy tests in your AdWords campaigns. It’s possible that over the last several years you’ve been making the wrong decisions based on very misleading data.
Many of us use metrics such as conversion rate, average order value (AOV) and revenue per impression to choose a winner in an A/B ad copy test. Based on the statistically significant ad copy test results below, which ad would you choose to run?
|
Ad Iteration |
AOV |
Conversation Rate |
ROI |
Revenue/Impression |
|
Ad A (control) |
$225 |
3.15% |
$7.79 |
$0.42 |
|
Ad B (test) |
$200 | 2.65% | $6.79 |
$0.37 |
The answer couldn’t be clearer. You should run ad copy A, right? After all, it does have a higher AOV, a higher conversion rate, a higher ROI and it produces more revenue per impression than Ad B. What on earth could possibly convince you otherwise? The metrics above tell a very clear story. But are these the right metrics to look at?
Measuring A/B Tests: What Metrics Should You Consider?
Conventional wisdom tells us that if we’re running a true A/B test, then impressions will be split 50/50 between the two ad iterations. If this assumption holds true, then the metric we really should be focused on is revenue per impression. This metric tells us how much revenue we’ll generate for every impression served, which accounts for differences in CTR, AOV and conversion rate. If your business is focused on maximizing growth, then this may be the only metric to consider. If you also are focused on efficiency, then you will consider ROI and choose the ad that you believe provides the optimal combination of revenue and efficiency. While this approach is common, it is also fatally flawed. Here’s why…
Why Google Can’t Guarantee True A/B Ad Copy Tests
Earlier, we made the assumption that impressions are split 50/50 in an A/B test. However, when running our own A/B tests we noticed that certain ads were receiving well over 50% of the impressions, and in some cases, upwards of 70-90% of the impressions. We experienced these results when selecting the ‘rotate indefinitely’ ad setting, as well as in AdWords Campaign Experiments (ACE) tests. So why were we seeing an uneven impression split? Did we do something wrong? Well, yes: we made the mistake of assuming that impressions would be split 50/50.
How Google Serves Ads – And Why Quality Score Is Not a Keyword-Exclusive Metric
When you set up an A/B ad copy test in AdWords, Google will split eligible impressions 50/50, but served impressions are not guaranteed to be split 50/50, or even close to 50/50. Eligible impressions will differ from served impressions when one ad produces a higher CTR than the other. Since CTR is the primary determinant of Quality Score (and thus, Ad Rank), the AdWords system may actually serve a higher CTR ad more often than a lower CTR ad. This happens because your keywords’ Quality Scores will change for each impression depending on which ad is eligible to show for that impression. In other words, each time the lower CTR ad is eligible to show, the keyword that triggered the ad will have a lower Quality Score for that impression, and thus, a lower Ad Rank (because the expected CTR is lower with that ad), so the lower CTR ad will win the auction less often than the higher CTR ad. Naturally, this results in more impressions for the higher CTR ad, even though the two ads each receive roughly 50% of eligible impressions. If you use revenue per impression, one of the metrics we suggested earlier, then you will have failed to account for the discrepancy in impressions caused by varying CTRs. So, does this mean that your A/B ad copy test results are now meaningless? Not so fast.
Evaluating Test Results Are Easier Than You Think – Just Look at Revenue (or Revenue per Eligible Impression)
Let’s assume that your goal is to maximize revenue. The simplest metric to look at in an A/B ad copy test is revenue, but you can also look at revenue per eligible impression. Both metrics allow you to account for the variations in impressions due to different CTRs. To calculate revenue per eligible impression for each ad, divide the revenue from that ad by the impressions from whichever ad produced the higher number of impressions. Here’s an example: let’s assume Ad A generated a CTR of 6% and received 50,000 impressions and Ad B generated a 4.5% CTR and received 30,000 impressions. Between the two ads, Ad A received more impressions, so we can conclude that there were 100,000 total eligible impressions (twice the number of impressions generated by Ad A). Ad B was not served for 20,000 of the eligible 50,000 impressions due to a lower CTR (which impacted the keywords’ Quality Scores and Ad Rank for those impressions). If the revenue per impression metric is confusing, just focus on revenue: it will give you the same outcome. Let’s revisit the test results we showed earlier, which now include additional data.
|
Ad Iteration |
Impressions | CTR | Revenue | Transactions | AOV | Conv. Rate | ROI | Revenue / Impression | Revenue / Eligible Impression |
|
Ad A |
114,048 | 5.95% | $48,095 | 214 | $225 | 3.15% | $7.79 | $0.42 |
$0.36 |
|
Ad B |
135,000 | 7.00% | $50,085 | 250 | $200 | 2.65% | $6.79 | $0.37 |
$0.37 |
While Ad A outperformed Ad B based on its revenue per impression, it actually generated less revenue and less revenue per eligible impression than Ad A. Ad A did generate a higher ROI, however, so the tradeoff between efficiency and revenue should also be taken into account.
Interestingly, Ad A’s 19% higher conversion rate and 13% higher AOV still couldn’t make up for Ad B’s 18% higher CTR. This is because Ad A also received 16% fewer impressions than Ad B. Remember, a lower CTR will lead to fewer clicks AND fewer impressions – the double whammy.
The Conclusion – Focus Less on Revenue/Impression and More on CTR
Historically we have treated CTR as a secondary metric when evaluating ad copy performance. It’s easy to manipulate CTR with Keyword Insertion or misleading offers, but it’s quite difficult to generate more revenue and/or improve efficiency with new ad messaging. However, with a renewed understanding of how CTR can impact impression share, we are now focused on CTR when testing new ads. As we saw in the example above, if your new ad produces a significantly lower CTR than the existing ad, it will take massive increases in AOV and/or conversion rate to make up for the lost revenue due to fewer impressions and clicks. Therefore, when writing new ads we recommend that you focus on improving CTR (assuming the ads still attract the right audience). This will produce three distinct benefits:
- Greater click volume due to increased CTR
- Higher Quality Score due to increased CTR, which produces lower CPCs and/or higher ad position
- Increased click volume due to higher impression share
We are all familiar with the first two benefits, but the third benefit represents the most value and is the one most often overlooked.
Next time you run an A/B ad copy test be sure to consider the impact CTR and impression share have on your test results. Avoid focusing on revenue/impression, AOV and conversion rate to determine a winner and instead focus on revenue/eligible impression or total revenue. This will ensure that differences in impression share are accounted for, and, ultimately, that the higher revenue producing ad is correctly identified. If efficiency is a key consideration, keep ROI in mind as well.

Oscar Predictions 2015 Recap
Last night’s Oscars proved to be quite the spectacle, with Neil Patrick Harris walking around in his underwear and everyone finding out who John Legend’s and Common’s real names are. The results were interesting as well, with only a handful of upsets. Having taken it all in, there are a few things I noticed regarding the selections made by some of the sites I polled, and the effectiveness of various winner-choosing methods.
First, how did I perform? Well, I ended up winning 20 out of the 24 categories (or 83%). This fared pretty well against the sites that I polled; only one of the nine sites beat me, I tied with one other site and the other sites all won fewer categories than I, with Hollywood Reporter performing the worst with only 13 wins.
When I took a closer look at which sites performed well and which ones did not, one thing became immediately clear; the individuals or sites that used statistics vastly outperformed the sites that did not. For example, Ben Zauzmer won 21 categories (beat me by 1) and GoldDerby’s predictions led to 20 category wins (tied me). The other sites I polled averaged roughly 16.5 wins, which is about 18% worse than the stats-based sites.
As I mentioned in my original article, the film that wins Best Film also wins Best Director about 72% of the time. Interestingly, 4 of the sites I polled actually chose two different films for Best Film and Best Director, which strongly indicates they were making decisions with their gut rather than with calculated probabilities.
I made the mistake of going with my gut when I chose “Joanna” for Best Documentary Short Subject, even though “Crisis Hotline” was a decisive favorite. I chose “Joanna” because I saw both films and simply felt it was a better film than “Crisis Hotline.” Unfortunately, there is no correlation between who I feel will win and who actually wins, so it was a poor decision on my part. Ironically, at the Oscar party I attended I ended up tying for first instead of winning first because of the one pick where I strayed from the probabilistic approach. I’ve learned my lesson as it pertains to selecting Oscar winners, and as a search engine marketer I was reminded that we cannot ignore what the data is telling us. A probabilistic approach can provide huge advantages when making key optimization decisions within your digital marketing campaigns.
One last thing I’ll mention is that Ben Zauzmer, whom I mentioned earlier, made a very astute observation regarding the Best Original Screenplay category. He noticed that the WGA correctly forecasts the Oscar winner for this category 70% of the time, which would have meant that “The Grand Budapest Hotel” was the favorite to win. However, “Birdman” was ruled ineligible by the WGA so it didn’t have an opportunity to win this award. Instead of blindly believing the numbers, he adjusted the model to account for the likelihood that “Birdman” would have won if it had been eligible, which resulted in predicting that “Birdman” would win Best Original Screenplay, which it did. As marketers, we are required to constantly synthesize, and sometimes question, the data to ensure we’re making decisions based on signals rather than noise (shout out to Nate Silver). This approach has shaped our campaign management strategies, and I’m hoping it will also help you make better marketing decisions moving forward.

